The Curious Chronology of Russian Twitter Bots


The creation dates of Twitter accounts in Lawrence Alexander's ‘bot’ sample provide ample evidence of automation. Images mixed by Tetyana Lokot.
Using open-source tools, Internet researcher Lawrence Alexander gathered and visualised data on nearly 20,500 pro-Kremlin Twitter accounts, pointing to extensive information manipulation attempts on the RuNet. In the second part of a two-part analysis, he discusses how bot behavior over time exposed key traits of these accounts and resonated with major political and social events.
Once I examined the scale and relationships of the bot networks in the first installment of my analysis, I decided to look into their chronology. Would examining the timeline behind their creation reveal further details as to their origin and purpose?
One of the Twitter metadata items NodeXL collected for the bot accounts was the “Joined Twitter Date.” This is an automatic parameter that can't be changed by the user, so it provides an accurate ‘birthday’ for each account.
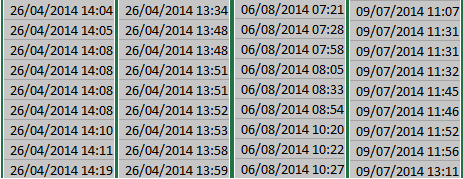
Bot time-stamp data in Excel, showing rapid account registration during short time periods.
Using Microsoft Excel, these figures—for all 17,590 bots—were visualized as scatter plots labelled by group (groups were formed based on the text content of the tweets). For comparison, I produced an identical graph for the 11,282-strong random sample group of accounts.
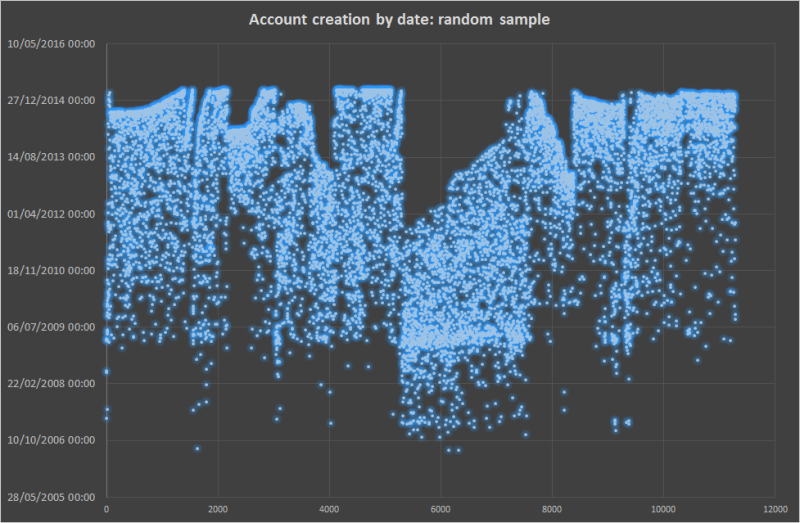
Timeline of creation dates for random sample of Twitter accounts. Image by Lawrence Alexander.
The vertical time-scale axis covers the entire history of Twitter, from its inception in July 2006 to the present day. The horizontal axis refers to the number of Twitter accounts, and therefore the sample size, of each group. They are arranged in the order that NodeXL originally collected them. The creation date of each account is signified by a blue dot.
As you would expect in a random sample group, there are few trends to be seen beyond a general increase in Twitter's popularity in its first four years. The timeline of the creation dates for bot account groups from my sample, however, tells a different story.
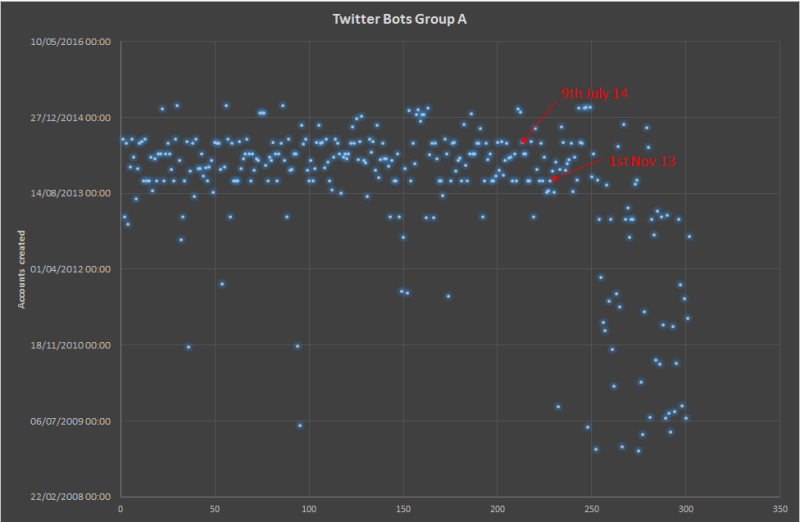
Timeline of account creation dates for Bots Group A. Image by Lawrence Alexander.
The Group A graph is taken from the sample of bot accounts sourced from @PressRuissa‘s tweet. You can see marked linear trends where multiple accounts were rapidly created on the same day, sometimes within hours of each other. This is characteristic of the automation that is typical for bot networks, and the same trend shows up in all four bot sample groups.
I marked dates of peak activity in red for clarity. Above, a rapid increase in account registration for Group A can be seen in November 2013 and July 2014.
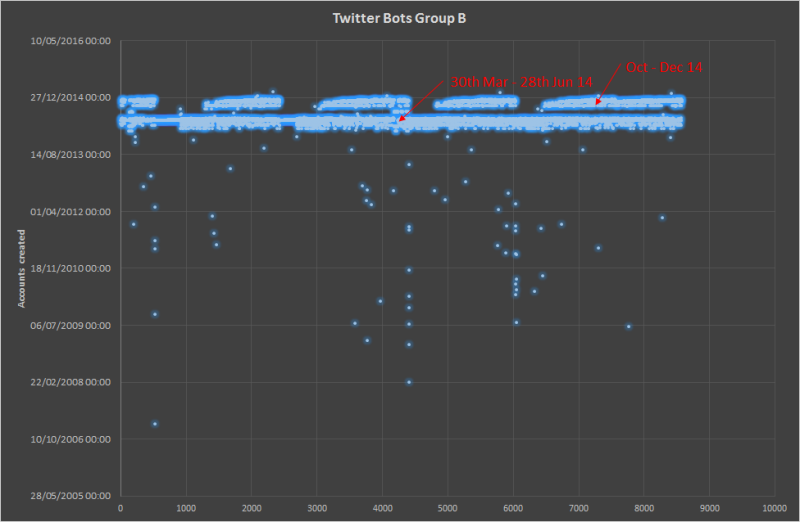
Timeline of account creation dates for Bots Group B, showing mass registration in short periods. Image by Lawrence Alexander.
Group B was sourced from suspected bot accounts based on their behavior and characteristics, as well as the distinctive RSS error message I referred to in the previous post. On the graph above, you can see two sharp peaks in account registration recorded for the spring and early summer of 2014, and later in the autumn of the same year. Relatively few accounts in the group were registered prior to this period.
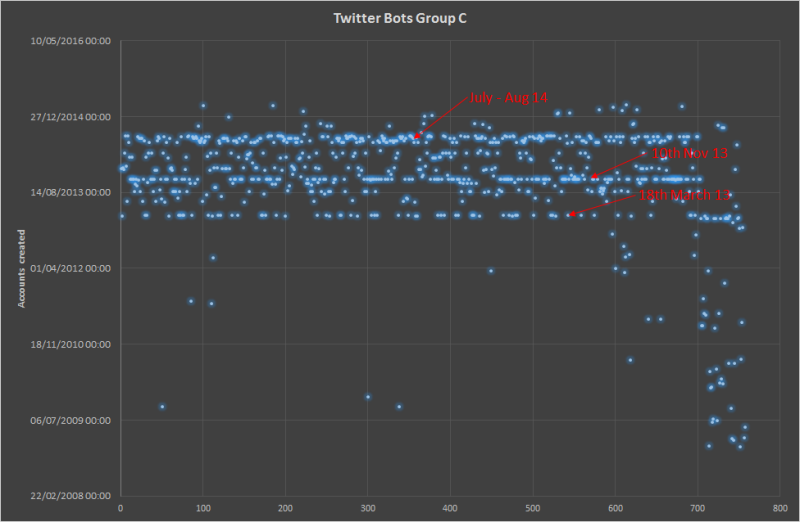
Timeline of account creation dates for Bots Group C shows three instances of rapid account creation. Image by Lawrence Alexander.
Bots for Group C were collected based on a tweet by a political analyst who reported an instance of suspiciously similar messages. The graph for this group shows a clear pattern of mass account registration in three batches, spaced eight months apart, as more bots were added to the network.
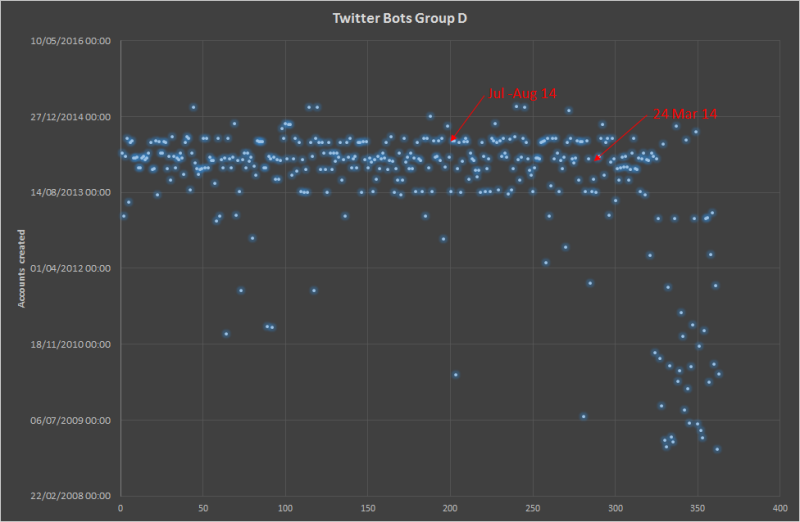
Timeline of account creation dates for Bots Group D. Image by Lawrence Alexander.
An Internews Ukraine media expert provided the screenshot that became my starting point for Group D (see graph above). Here, the automation trends are less distinct, partly because the data set is smaller. However, the pattern of rapid account registration, peaking in the summer of 2014, is still clear.
Although these results cannot guarantee a comprehensive conclusion about the nature of the ‘bot’ accounts, it's interesting to note that periods of increased bot registration coincided with the start of the Euromaidan protests in Ukraine (late fall and winter of 2013) and the subsequent armed uprisings by pro-Russian militants in eastern Ukraine (early spring 2014).
This post is part of RuNet Echo, a Global Voices project to interpret the Russian language internet. All Posts · Read more »


3 comments